
Data privacy, data standards, data bias, open data portals…with all these solutions and social issues, how can local government managers improve their organizations’ operations, customer service, and policy decision-making with data? Members of ICMA’s Smart Communities Advisory Board have discussed the challenges local government managers face in using data and identified key benefits that local government managers should expect from their data.
Use Data Analytics to Improve Decision-Making
- Evolve operations.
- Support policy decisions.
- Are you asking the right questions?
- Enhance communications.
- Improve customer service.
- What challenges do you have using data?
- What do you want to get out of the data?
- What data do you wish you had?
Connect People and Data
- A compelling narrative makes a good data story. Put a face to it, associate it with culturally relevant problems, show its importance, or tie it to particular beliefs.
- Determine the type of qualitative and quantitative data to help tell the story.
- Identify the audience and present it in a format that is understandable.
Ask About Data Quality
- Who is tasked with overseeing data standards?
- How is the data collected and stored?
- How is private data protected against hackers?
- Are there data quality checks for each data set?
Develop a Culture that Embraces Data
- Measure data quality through employee surveys.
- Set data excellence targets, i.e., increasing water system data integrity with diameter, ownership, and maintenance attribution.
- Communicate outcomes to improve confidence in the data.
- Recognize required impact on workload to improve data quality.
Address Lack of Data Connectivity Between Systems
- Use open source software.
- Establish an open data committee.
- Develop a data governance policy.
- Identify an executive sponsor.
- Involve the staff who work with the data.
Recognize the Limitations of Data
- Bias can be built into data.
- Belief that the data result is the only answer.
Learn What Other Tools Local Governments Are Using
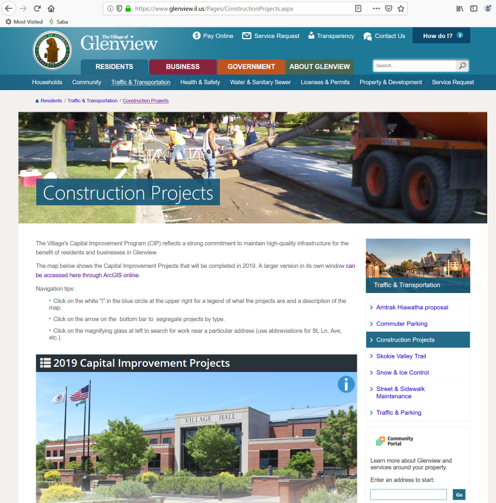
Glenview, Illinois, chose to develop an online story map that is accessible through various pages. The map featured the village’s capital improvements plan (CIP) and its construction plans to residents via blogs.
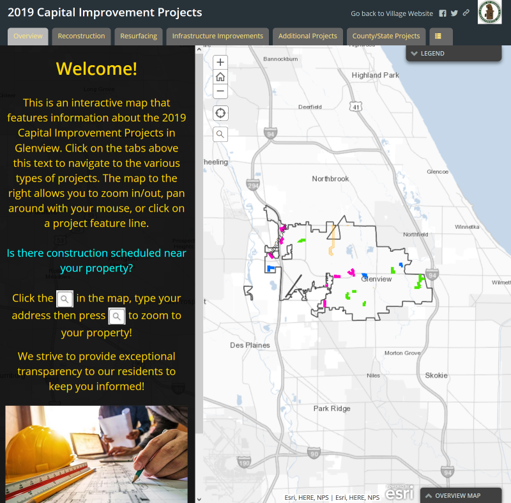
The image below provides access to the construction page. Once the Story Map tool is selected as shown on the right, users are brought to a series of tabs that enable the user to toggle to the different types of infrastructure and construction projects featured on the pages.
For each project, there is a list of information on the left side. This includes the project:
- Name—Click on the name and the map will zoom to that specific project.
- Extent (from street x to street y).
- Hyperlink to see status updates and sign up for the emailed project updates.
- Detailed list of what work is being done with that project.
- Estimated start/completion dates.
- Project manager’s contact information.
As a user scrolls down in the left panel, he or she will be able to see the various projects and their related information.
The map window below has interactive map capabilities, including zooming in/out and panning with a mouse. The magnifying glass allows you to type in your address to zoom to a property, and the house button brings the map back to the original default extent. In the upper right corner of the map is a legend that can be expanded. In the lower right corner, an “overview map” can be expanded. Lastly, if a mobile device is being used and the user can click on the “locate me” button above the magnifying glass in the upper left corner, the map will zoom to the desired physical location.
County- and state-managed projects within the village limits can also be used to monitor progress on existing projects, as well as future projects, that highlight the village’s five-year plan. Questions about construction projects can be directed to the project manager listed beneath the respective project or general questions can be directed to the contacts that are listed on the “Contact Information” page.
The CIP story map has proven itself to be an intuitive, user-friendly, and interactive way to use data to visually understand where construction is occurring in the village and to communicate project updates to residents.
New, Reduced Membership Dues
A new, reduced dues rate is available for CAOs/ACAOs, along with additional discounts for those in smaller communities, has been implemented. Learn more and be sure to join or renew today!